Plant health has become one of the most discussed topics in modern horticulture. Growers, advisors and researchers all agree on one thing: healthy plants are the foundation for resilient crops, stable production and reduced dependency on crop protection. Yet when plant health is discussed, the conversation often becomes complex very quickly.
Understanding Plant Health through the Eh–pH diagram
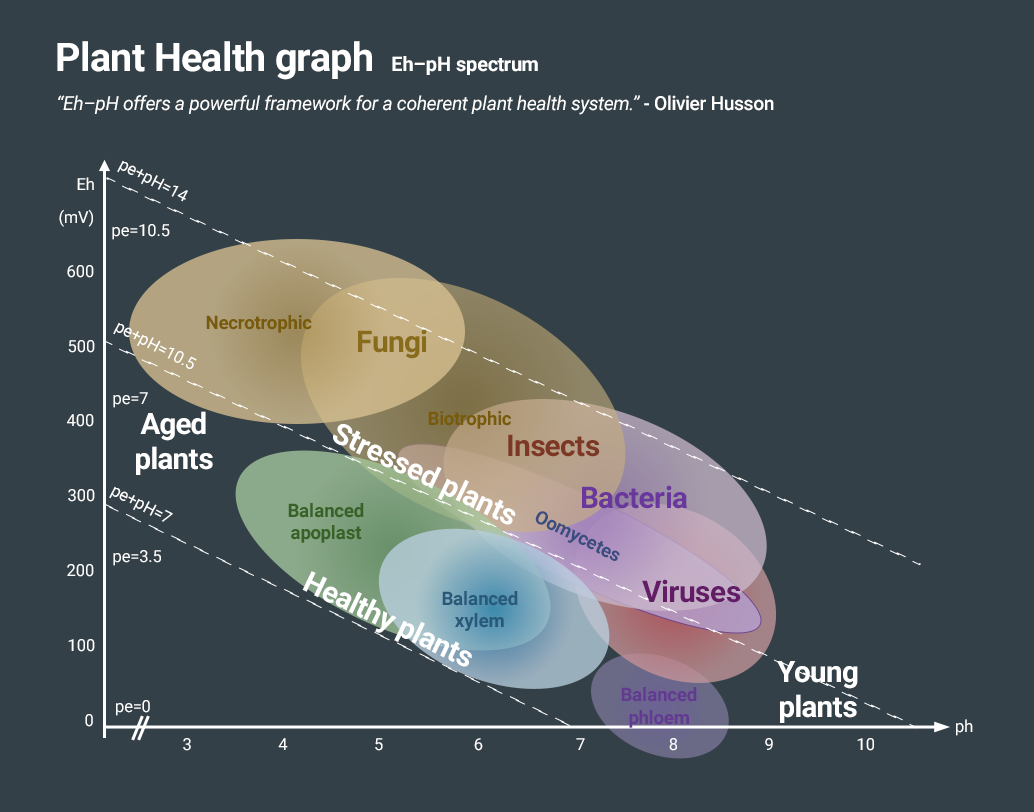
A good example of this complexity is the Eh–pH diagram, developed and explained by Olivier Husson. For many growers, this diagram feels abstract, theoretical and difficult to translate into daily greenhouse decisions. And honestly, that reaction makes sense.
What does the Eh–pH diagram show?
The Eh–pH diagram visualizes the relationship between redox potential (Eh) and acidity (pH). Together, these parameters describe the chemical environment in which plants, microorganisms, pests and diseases operate.
What makes the diagram so powerful is also what makes it challenging:
- A healthy plant operates in a very specific Eh–pH zone
- That zone is not where pathogens like Pythium thrive
- It is not where mildew develops easily
- And it is not where insects such as aphids perform best
Each organism has its own “comfort zone”.
The diagram shows that problems often do not start with the pest or disease itself. They start when growing decisions such as irrigation, nutrition or oxygen availability slowly push the plant out of its optimal zone. Once that happens, the plant may end up exactly where pests and diseases feel at home. And that is when issues appear.
Why this knowledge feels difficult to apply
The challenge is not that this knowledge does not exist.
The challenge is that it is often presented in isolation.
Growers are rarely managing Eh or pH as standalone parameters. They are managing:
- irrigation strategies
- fertilizer recipes
- climate settings
- substrate properties
- microbial activity
All at the same time.
Small shifts in one area can influence the entire system. The Eh–pH diagram makes this visible, but it does not automatically tell you what to do next.
From complexity to coherence
At Plant Empowerment, we believe complexity is not something to avoid. It is something to structure.
That is why we created the year program Mastering the dynamics of your plant. In this program, we use frameworks like the Eh–pH diagram not as abstract theory, but as tools to understand how different growing decisions interact around one central point: the plant.
You can follow the free webinar about understanding Eh–pH
About the course

Module 1: Understanding the basics

Module 2: Mastering pests & diseases

Module 3: The perfect growing conditions

Module 4: building strong & resilient plants
Continue reading

How do climate strategies influence plant health and pest pressure?
Open: How do climate strategies influence plant health and pest pressure?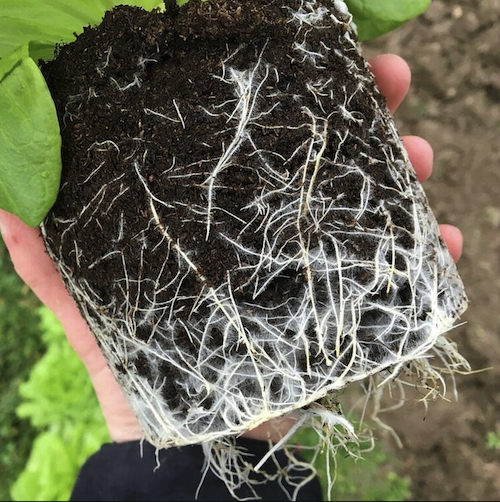
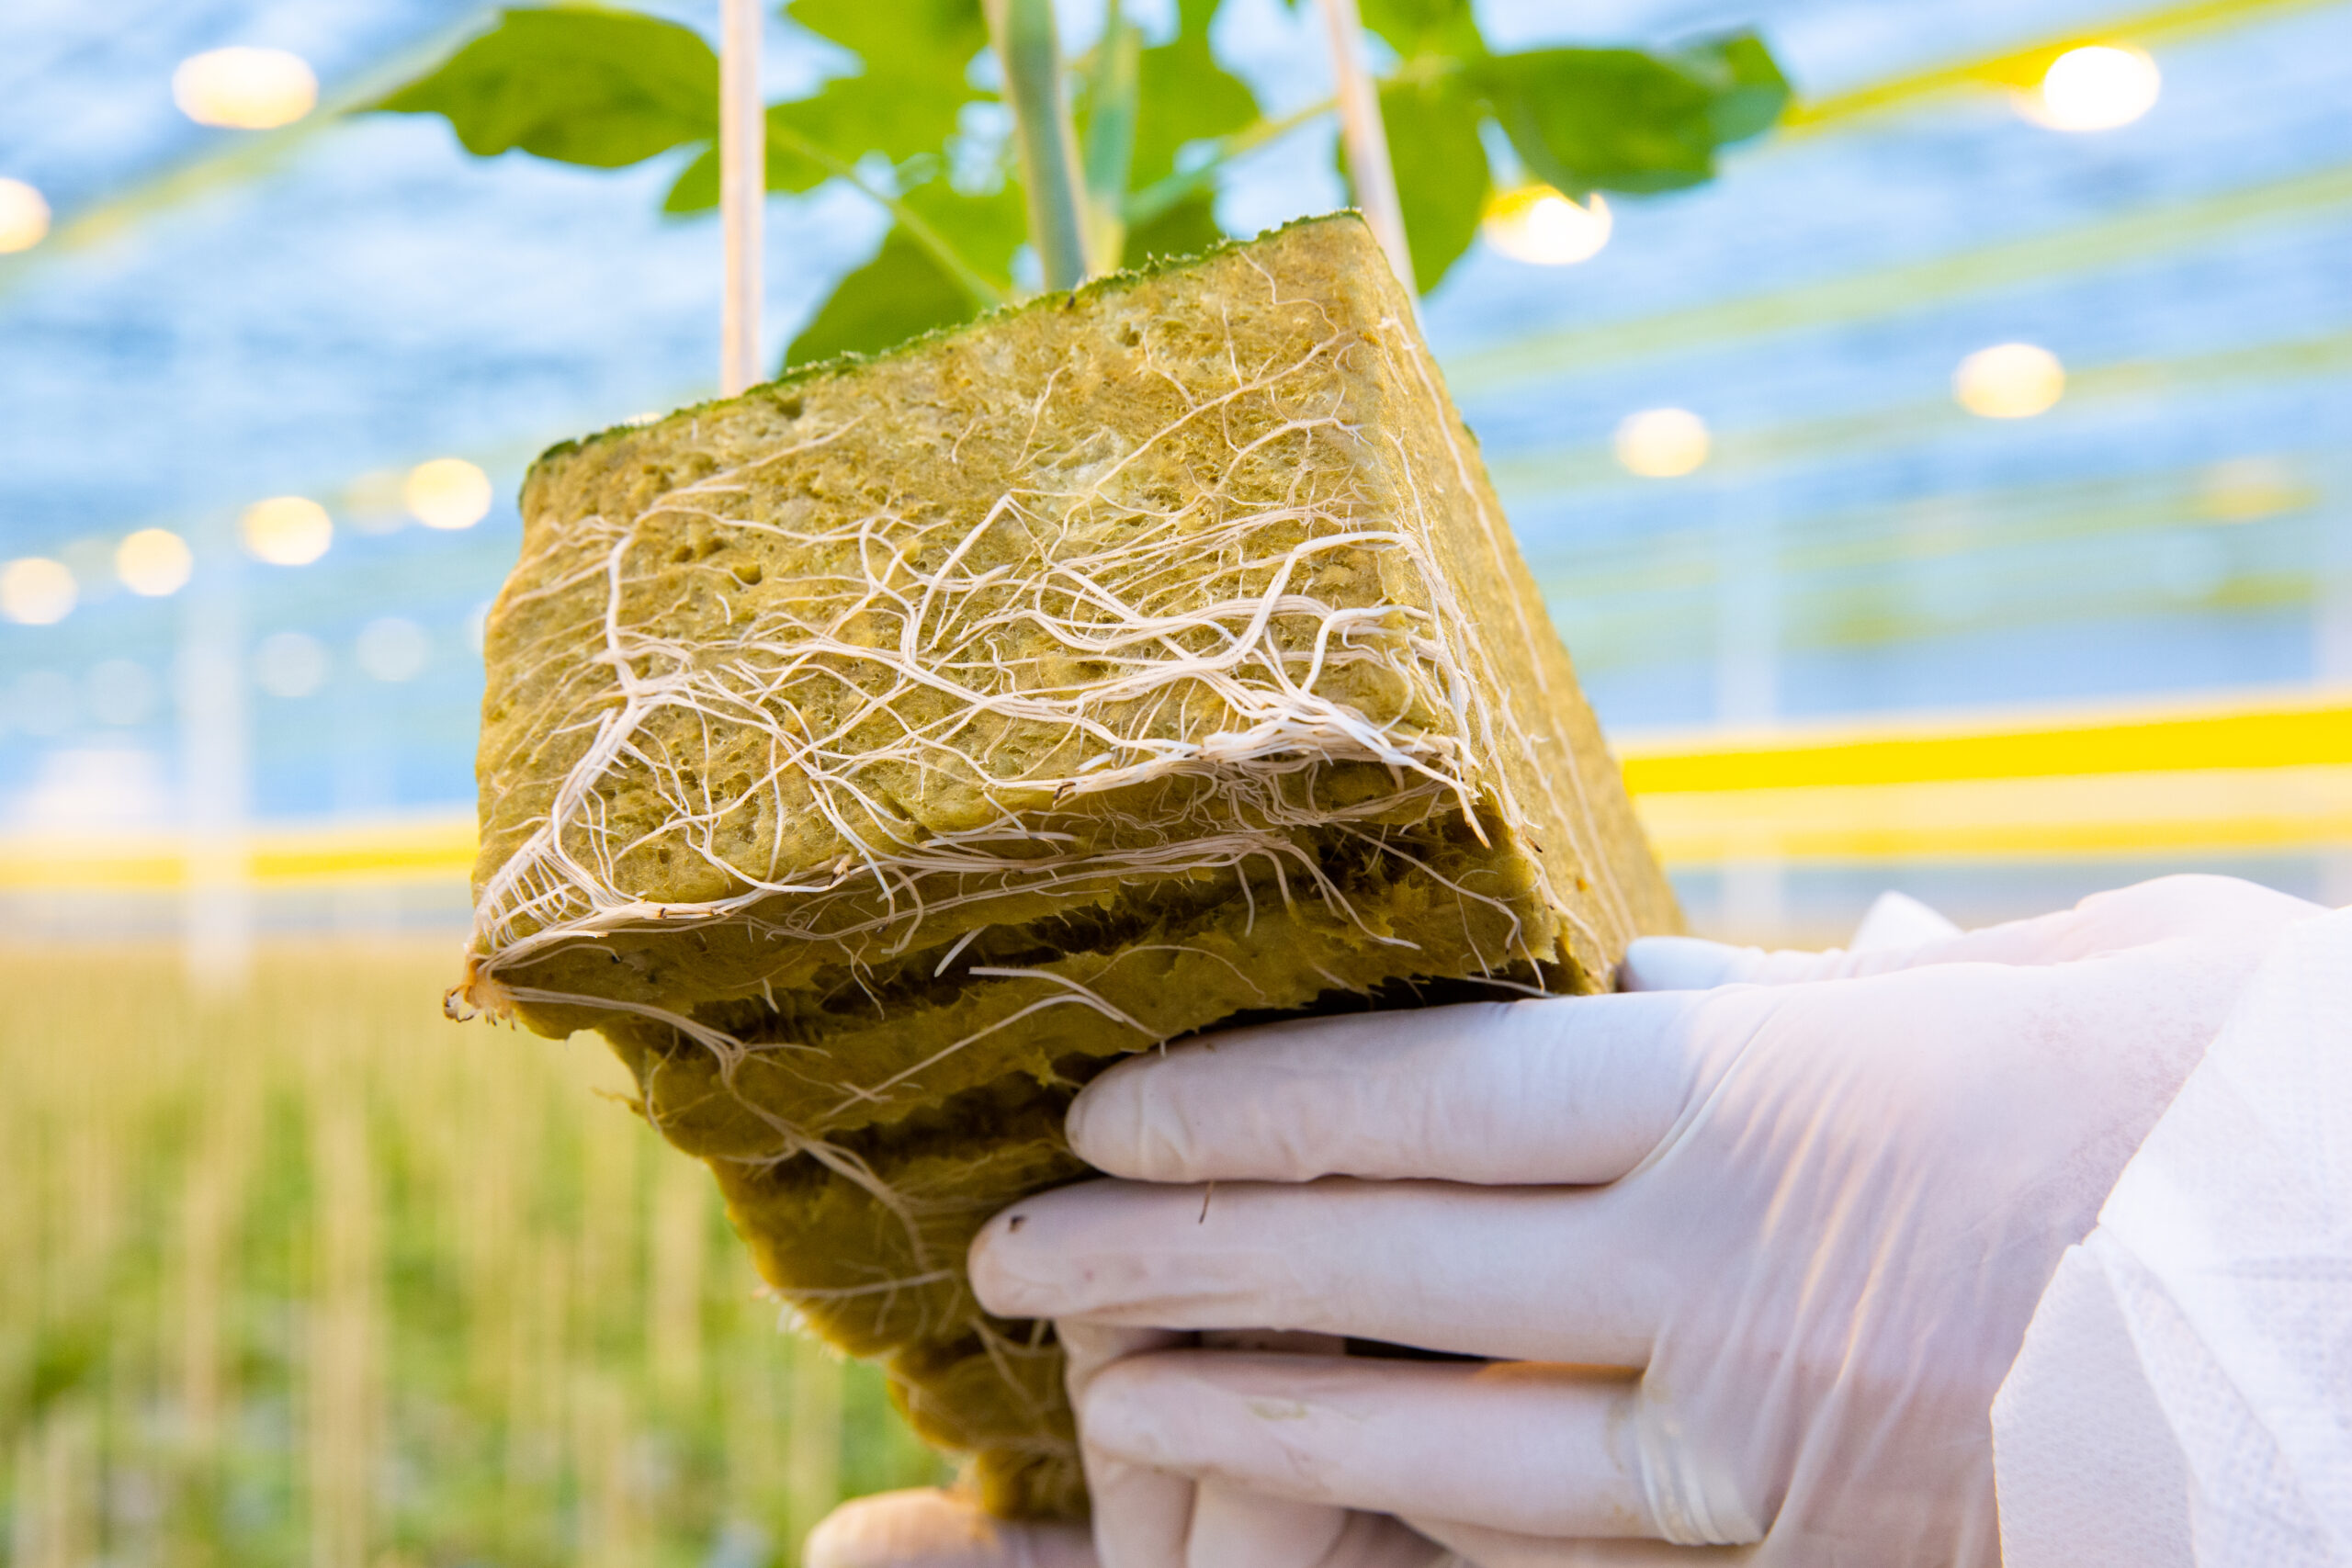
How do you create a healthy rootzone in greenhouse crops?
Open: How do you create a healthy rootzone in greenhouse crops?
Why do spider mites keep coming back in your greenhouse?
Open: Why do spider mites keep coming back in your greenhouse?